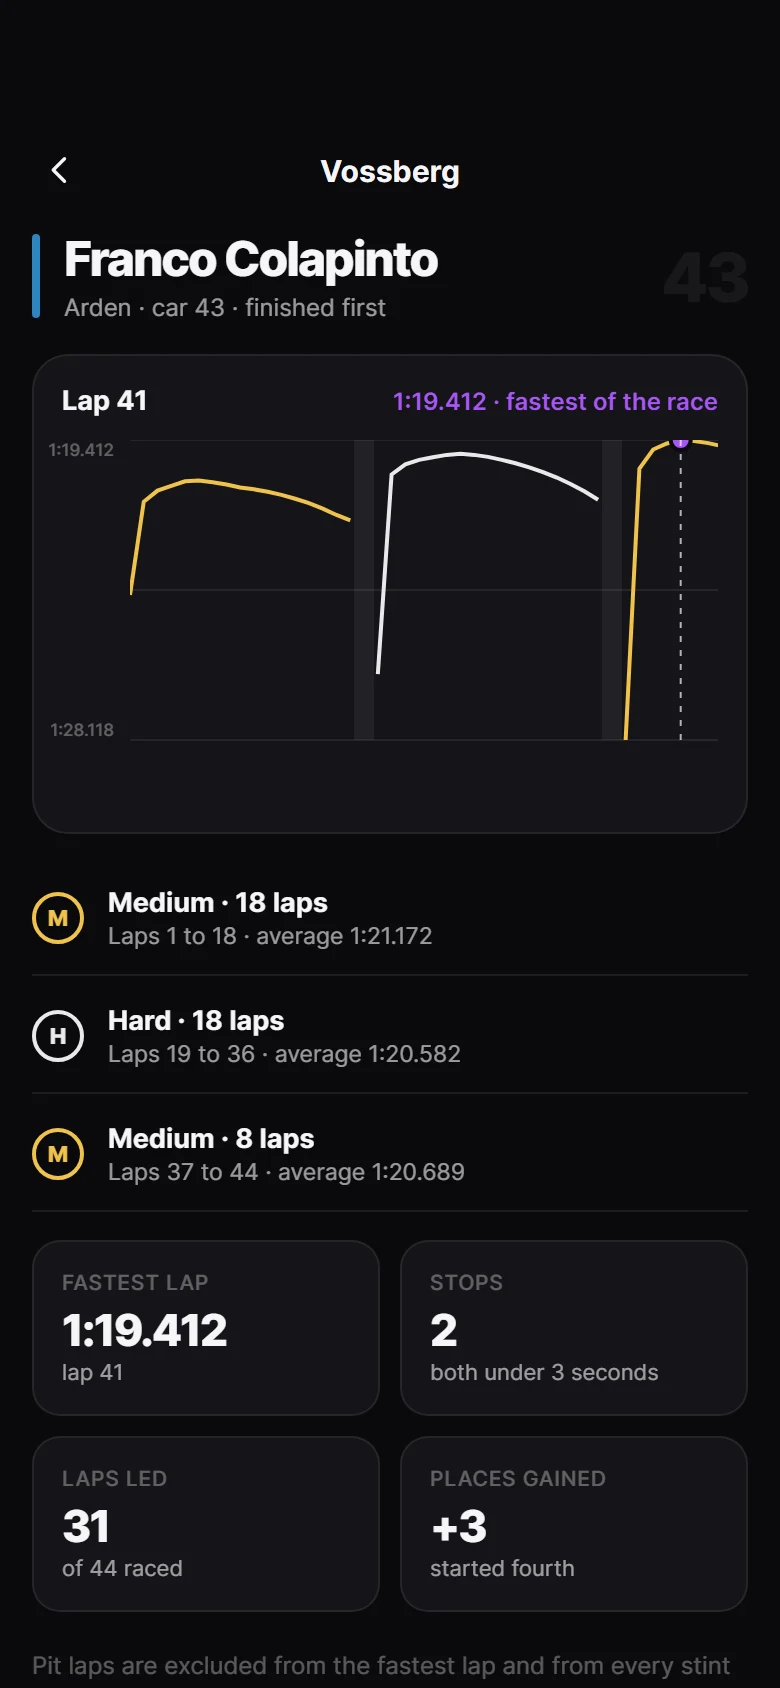
ライブプレビュー、プロンプトが運ぶのと全く同じコードで動作しています
統計・グラフ画面 Expo Go対応無料
Swell Tide Table
A tide curve interpolated between four turns so the graph and the table are one fact drawn twice, with rising or falling read off the curve and past turns kept on the list rather than removed.
Claude Code、Cursor、Windsurfに貼り付けてください。この画面をあなたのアプリに1対1で構築します。
含まれるもの
- ファイル
- 1個のファイル
- 依存関係
- @expo-google-fonts/inter, phosphor-react-native, react-native-safe-area-context, react-native-svg
- フォント
- @expo-google-fonts/inter
- 互換性
- Expo SDK 52以上、Expo Goで動作
- 更新日
- 2026-09-09
このデザインが従うルール
プレビューと全く同じ状態で提供されます:同じ色、同じタイポグラフィ、同じテキスト、同じモーション。プロンプトはあなたのエージェントに、既存のテーマに合わせて調整せず、そのまま構築するよう指示します。